Tracking vs. Analyzing Content Time: Key Differences
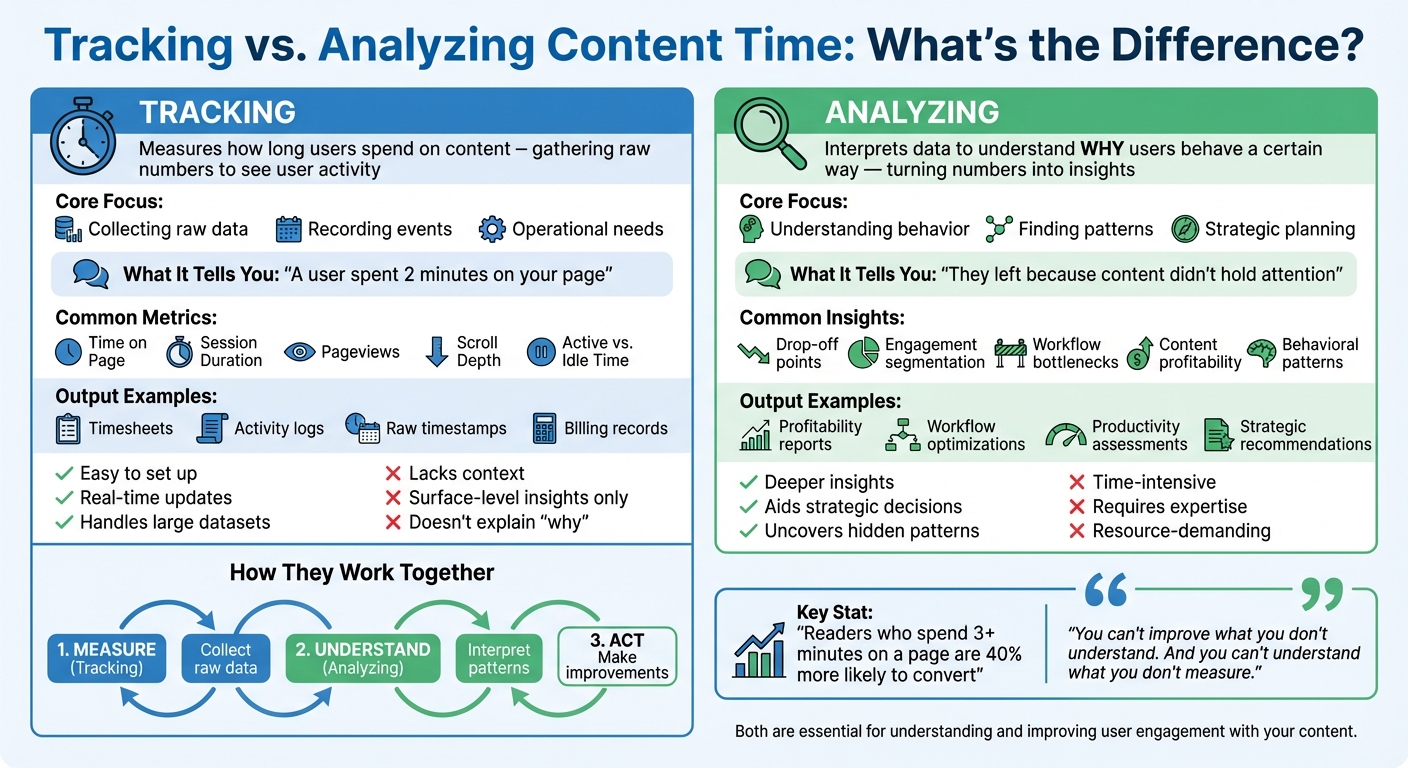
Tracking content time measures how long users spend on your content - like time on a page or session duration. It's about gathering raw numbers to see user activity. Analyzing content time goes further, interpreting that data to understand why users behave a certain way - like identifying if they were engaged or simply left the tab open.
For example: tracking tells you a user spent 2 minutes on your page, while analysis explains they left because the content didn’t hold their attention.
The two work together: tracking provides the data, while analysis turns it into actionable insights, helping you improve engagement and content strategy.
| Aspect | Tracking Example | Analyzing Example |
|---|---|---|
| Focus | Collecting raw data | Understanding behavior |
| Output | Time spent on a page | Identifying drop-off points |
| Purpose | Recording events | Improving user engagement |
Both are essential for understanding and improving how users interact with your content.
Tracking vs Analyzing Content Time: Key Differences Comparison
What is Tracking Content Time?
Definition and Purpose
Tracking content time involves measuring how long a user spends interacting with a webpage. While it doesn’t evaluate the quality of that interaction, it provides a solid baseline for understanding user behavior.
As KISSmetrics explains:
Time on page is a proxy for engagement and content quality.
This approach goes beyond basic pageviews, offering insights into how long visitors stay engaged with content. Traditionally, time is calculated as the gap between a page load and the next internal click. In such cases, if a user leaves without clicking, the session records as zero seconds. However, modern tracking methods use "heartbeat events", which send periodic pings - typically every 10–15 seconds - to capture dwell time more accurately.
Let’s break down the metrics that underpin this tracking system.
Common Tracking Metrics
Content time tracking relies on several key metrics:
- Time on Page: Calculates the time between a page load and the next internal click.
- Session Duration: Measures the total time a visitor spends across all pages during a single visit, ending after 30 minutes of inactivity.
- Engaged Time: Focuses on active interaction, counting only when the user is engaging with the page and the tab is in focus.
Other metrics, such as pageviews (how often a page is loaded or reloaded) and scroll depth (how far down a user scrolls), also contribute to understanding engagement. Many platforms utilize the Page Visibility API, which pauses tracking when a user switches tabs, ensuring only active time is recorded.
These metrics provide the foundation for analyzing user engagement and understanding how effectively content captures attention.
sbb-itb-d395ae5
What is Analyzing Content Time?
Definition and Purpose
Tracking gives you the raw numbers, but analysis digs deeper - it helps explain why users behave the way they do. Think of it like this: tracking tells you someone spent two minutes on your page, while analysis reveals they left because the middle section didn’t hold their attention.
Analysis goes beyond basic metrics to uncover patterns and trends. For example, looking at copy events - when users hit Ctrl+C to copy text - can highlight deliberate user actions. On Stack Overflow, 25% of visitors copy text within five minutes. Similarly, around 22% of unique visitors on software documentation sites perform at least one copy operation. These actions suggest users found something meaningful enough to save for later.
By turning raw data into actionable insights, analysis helps you refine strategies to keep readers engaged. It works hand-in-hand with tracking to bridge the gap between knowing what’s happening and understanding why it’s happening.
Common Analysis Insights
Content analysis uncovers behavioral patterns that directly inform your content strategy. Take scroll depth data, for example - it shows exactly where readers stop engaging. Since most readers drop off before reaching the halfway point of an article, this insight can guide decisions like restructuring your introduction or moving key points higher up.
Another powerful tool is engagement segmentation, which categorizes audiences into highly engaged, moderately engaged, and low-engaged groups. This allows you to tailor content recommendations based on how different groups consume your content. Then there’s the concept of "sleeping giants" - content that retains readers well but has low click-through rates. These pieces might just need a better title or thumbnail to grab attention, not a complete overhaul.
For video creators, second-by-second retention graphs are invaluable. They show exactly where viewers lose interest. A sudden drop 30 seconds into a video might point to a dull segment or an awkward transition that needs fixing. Publishers, on the other hand, can use benchmarks like the global average engaged time of 26 seconds to gauge whether their content is holding attention or being abandoned too quickly.
Key Differences Between Tracking and Analyzing
Core Goals: Tracking vs. Analyzing
Tracking and analyzing might use the same data, but their purposes are entirely different. Tracking is all about gathering raw numbers - like how long users stay on a page or when they leave. It's purely about recording events without adding any interpretation.
Analyzing, on the other hand, takes that raw data and digs into the "why" behind it. It’s about understanding what those numbers mean and why they matter. David Whitaker from Kickidler explains it perfectly:
Running a business without clear insights into how your team spends their working hours is like wandering blindly in the dark without a flashlight.
Through analysis, patterns and trends emerge - things that tracking alone can’t reveal.
In short, tracking gives you the hard facts - numbers, timestamps, and totals - while analysis goes beyond the surface to uncover deeper insights .
Metrics and Outputs Compared
The difference between tracking and analyzing becomes even clearer when you look at their outputs. Tracking produces straightforward records like timesheets, activity logs, and invoices. These are essential for tasks like payroll or billing . Analysis, on the other hand, delivers actionable insights - profitability reports, workflow optimizations, and productivity assessments that help shape strategic decisions.
Here’s a side-by-side comparison to highlight how they differ:
| Metric Type | Tracking Example | Analyzing Example |
|---|---|---|
| Raw Data | Time spent on a specific article | Comparing content profitability vs. labor costs |
| User Behavior | Active vs. idle time during a session | Identifying workflow bottlenecks |
| Project Management | Actual hours worked vs. scheduled hours | Improving accuracy for future time estimates |
One key takeaway is that tracking addresses operational needs like billing accuracy and compliance. For example, new EU regulations will require all businesses to track employee work hours starting July 1, 2024. Meanwhile, analysis serves strategic goals, helping businesses allocate resources better or predict project timelines. Tracking tells you what happened; analysis helps you decide what to do next.
How Tracking and Analyzing Work Together
Tracking as the Foundation
Tracking is where it all begins - it’s the step that gives you the raw data needed to make informed decisions. Vahagn Sargsyan, Founder and CEO of WebWork, sums it up perfectly:
You can't improve what you don't understand. And you can't understand what you don't measure.
Think of tracking as flipping a switch to illuminate a dark room. It captures the essentials: exact durations, application names, and activity percentages. These are the "vital signs" of your content, providing metrics like average view duration and scroll depth. While critical, these numbers only tell you what's happening. They don’t explain why it’s happening or what you should do next.
The key is to structure this data. Without organization, raw numbers can feel overwhelming - like staring at a spreadsheet with thousands of entries and no clear direction. Sargsyan puts it this way:
Raw data is overwhelming. Thousands of entries. Too much detail. Too little meaning. But once time data is grouped, structured, and visualized, something changes: It starts to speak.
This is where analysis comes in. It takes those raw numbers and turns them into a narrative - one that helps you understand whether your audience is engaged or merely skimming. Once structured, the data becomes a tool for strategy.
Combining Both for Better Results
The most effective workflow follows a simple cycle: measure, understand, and act. With advancements in AI, this process has become even more efficient. AI tools can sift through vast amounts of data, while distraction-free platforms like Fifteen help reduce the mental load of switching between tasks. For instance, Fifteen offers a clean, chronological feed that consolidates content from up to 15 sources. It eliminates algorithms and unnecessary tracking, cutting down on the "context switching tax" that often disrupts focus and skews data analysis.
This seamless integration of tracking and analysis can reveal actionable insights. For example, you might discover that a blog post has high time-on-page but low traffic, suggesting it’s a hidden gem that needs better promotion. Or, you might realize that although you feel productive, only 15% of your time is spent on truly focused, deep work. These kinds of insights turn raw data into a roadmap for improving performance and strategy.
Pros and Cons of Each Approach
Tracking: Pros and Cons
Tracking offers straightforward, real-time data collection by logging metrics like page views, session durations, and activity logs. This is especially useful for high-frequency platforms like daily social media posts, where quick trend-spotting or identifying technical hiccups is essential. For instance, Platinum Companies saw a 10% boost in billable hours after adopting tracking systems.
That said, tracking only shows what happened, not why. For example, if users spend a lot of time on a page, tracking alone can’t tell you whether they’re engaged or just left the tab open. As Vahagn Sargsyan, Founder and CEO of WebWork, aptly states:
Tracking time is easy. Understanding it is the hard part.
In short, while tracking gathers raw data effectively, it lacks deeper context.
Analyzing: Pros and Cons
Analyzing takes raw data and transforms it into meaningful insights, helping uncover reasons behind user behavior. This method enables strategic decision-making, like identifying content that performs well in engagement but struggles with traffic, so you can focus on promoting it better. Plus, studies show readers who spend over three minutes on a page are 40% more likely to convert through actions like downloads or registrations.
On the downside, analysis demands significant time, effort, and resources. Specialized tools and expertise are often necessary to interpret the data accurately. For example, one CEO discovered through analysis that only 15% of his time was spent on deep, focused work, despite feeling constantly busy. Such insights, while valuable, often come at a high cost in terms of effort.
Side-by-Side Comparison
Here’s a quick look at how tracking and analyzing stack up:
| Approach | Advantages | Limitations |
|---|---|---|
| Tracking | Easy to set up, real-time updates, handles large datasets effectively | Lacks depth and context; offers surface-level insights |
| Analyzing | Provides deeper insights, aids strategic planning, uncovers hidden patterns | Requires significant time, resources, and expertise; prone to interpretive bias |
Content Analytics: How to use Google Analytics for tracking Content Websites
Conclusion
Combining tracking with analysis gives you a clear and actionable understanding of your habits. As Vahagn Sargsyan, Founder and CEO of WebWork, aptly states:
You can't improve what you don't understand. And you can't understand what you don't measure.
Tracking shows you what happened, while analysis dives into why it matters and what steps to take next.
The process is straightforward: Measure → Understand → Act. Start by tracking your content habits - like how much time you spend scrolling versus actively engaging - and use that data to make adjustments.
This is where Fifteen steps in. By eliminating algorithms, ads, and engagement traps, it offers a space where your time is shaped by your choices, not the platform's design. You follow up to 15 people you truly value, read posts in chronological order, and save meaningful content - all without the endless scrolling or algorithm-driven distractions.
Did you know people often underestimate their screen time by over 30%? Without tracking, you’re relying on memory, which can be unreliable. Without analysis, the numbers alone won’t tell you much. Combine both to gain clarity, regain control, and focus on what truly matters.
A simple way to start? Track your time across broad categories like Learning or Leisure, then review your results weekly. Compare what you planned to do with what actually happened, and you’ll quickly spot areas to refine.
FAQs
Why can time-on-page be misleading?
Time-on-page might seem like a solid way to measure user engagement, but it can be deceptive. Metrics like average time on page depend on indirect calculations - such as the gap between pageviews - which often fail to capture the full picture. For instance, the last page a user visits in a session typically logs zero seconds since there’s no follow-up action to measure against. These gaps can skew the data, making it harder to accurately evaluate how effective your content really is, and this could lead to flawed decisions.
What’s the difference between engaged time and session duration?
Engaged time tracks the active moments a user spends interacting with your site or app - things like scrolling, clicking, or moving the mouse. If the user becomes inactive or switches tabs, the timer stops. On the other hand, session duration measures the total time between pageviews, even if the user isn't actively engaging. This can lead to inflated engagement stats since it includes passive time.
How do I turn time data into content improvements?
To make the most of time-related data, dive into metrics like time spent on page, scroll depth, and interaction patterns. These numbers tell a story about how your audience engages with your content. Are they sticking around? Are they scrolling all the way through?
For instance, if certain topics or formats consistently lead to longer engagement, that's a clear signal to create more of that type of content. On the flip side, if some pieces aren’t holding attention, it might be time to tweak or replace them.
By using these insights, you can fine-tune your strategy - focusing on what clicks with your audience and cutting out what doesn’t.
Track your reading with intention. Try Fifteen →
See also: The Fifteen Manifesto — why we track attention, not engagement.
See also: RSS Feed Readers for Intentional Reading — the tools to make it happen.